Health Checks
A Health Check checks the state of systems before, during, and after an experiment, Scenario, or reliability test. They're used to monitor the state of your systems to ensure they're still operating within your expectations. Health Checks also provide a level of safety when running tests: if your systems become unstable, unresponsive, or unhealthy, Health Checks will automatically halt ongoing tests and return your systems to normal operation.
Health Checks work by sending REST API requests to an endpoint that you specify: typically this is a monitor or alert in your observability tool. Gremlin sends a request to the monitor and checks the response time, response status code, and optionally a JSON payload against your success criteria. If any field fails to meet the criteria, the Health Check identifies the failure and signals the active test to stop. We strongly recommend using monitors and/or alerts as endpoints for Health Checks, since your team likely already uses these to measure the health of your service.
Gremlin natively supports Datadog, New Relic, PagerDuty, and several other tools listed below. Gremlin also supports custom endpoints so you can integrate any tool of your choice.
Managing Health Checks
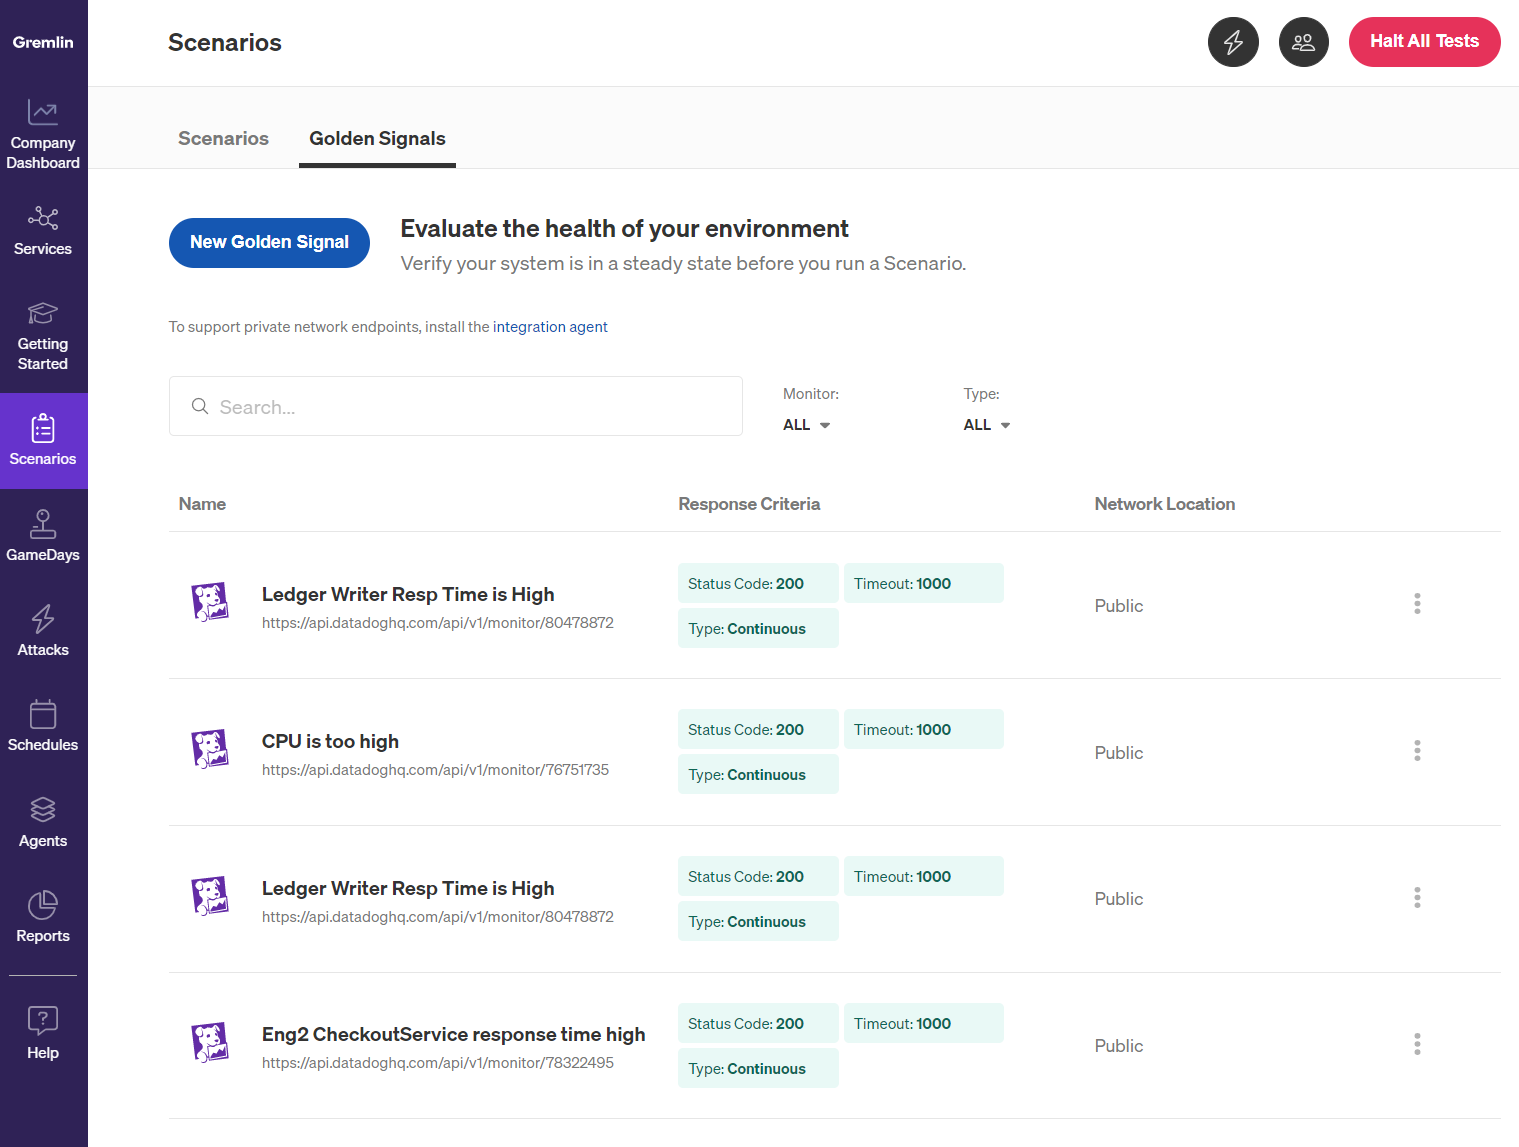
You can view your Health Checks in the Gremlin web app by clicking on Health Checks in the left-hand nav menu, or by going to app.gremlin.com/health-checks/. This page shows every Health Check available to your Gremlin team and lets you create, edit, or delete Health Checks.
Health Check authentication
When you authenticate with an observability tool for the first time, Gremlin saves the authentication details. This way, you can reuse the same authentication details instead of having to redefine them for every new health check you create. These authentication details are also available to other members of your Gremlin team.
You can view and edit all saved authentication details by clicking on Health Checks in the left-hand nav menu and then clicking Authentication, or simply visit app.gremlin.com/health-checks/authentication.
Creating Health Checks
To create a new Health Check, click the + Health Check button in the top-right corner of the page.
Choosing an observability tool
First, you must select the observability tool you wish to use. Click on the Observability Tool drop-down menu to see the list of available options. Click on the link for your tool in the list below for instructions on how to use that tool. Note that the options may change depending on which tool you select, and whether someone else in your Gremlin Team has already authenticated with that tool:
Once you've entered authentication details for an observability tool, you can reuse the same authentication for other monitors. After you've followed the instructions for your specific tool, continue with the following instructions.
Private Network Endpoints
By default, Health Checks require your endpoint to be accessible by Gremlin's servers. If your endpoint is hosted internally (i.e. behind a firewall), or if you have strict network security policies that prevent you from exposing your systems to the Internet, you can use a Private Network Endpoint instead. Private Network Endpoints let you monitor Health Checks from within a private network. You can enable this by selecting Yes under Is this observability tool behind a firewall or on-prem?
Naming your Health Checks
Enter a name for the Health Check in the Name text box. As a best practice, we recommend naming your Health Checks after their respective monitors or endpoints. This makes it easier to mentally connect a Health Check to a monitor, and to know which Health Checks to use when creating new services in Gremlin.
Once you create a Health Check, it will appear in your team's health check list. All members of your Gremlin team will be able to use these Health Checks in their experiments, Scenarios, or reliability tests. Saved Health Checks also include success evaluation criteria.
Editing Health Checks
To edit a health check, click the Edit button next to the health check you want to modify. You can change its name, URL, success evaluation criteria (for custom tools), and the headers used for authentication.
Copying Health Checks
To copy a health check, click the Clone button next to the health check you want to copy. This opens the health check creation form with the details of the cloned health check already entered. This is useful for quickly adding a new health check without having to re-enter authentication details, custom URLs, or custom headers.
Deleting Health Checks
To delete a health check, click the Delete button next to the health check you want to delete. Click Delete again to confirm.
This is the last health check for [service name]. If you need to delete it, please add a new one first. Be sure to add another health check to the service before deleting this one.Health Checks IP ranges
If your firewall is blocking the utilization of the Health Check feature, and you are unable to use Private Network Endpoints, you will need to add the following IP address to your allow list.
144.236.227.116254.186.237.228344.239.162.49444.240.200.121