Datadog Health Check
For Datadog, Gremlin automatically sets the base URL. You just need to choose your Datadog site from the drop-down list, enter your API key and Application Key, then enter the URL for your monitor. These two values can be copied or created in the Datadog web app. See Add an API key or client token and Add application keys in the Datadog documentation for details.
In addition, the Monitor URL must contain the ID or API endpoint of a Datadog monitor relevant to the Service you are creating in Gremlin. You can get this from the Datadog web app by navigating to the Monitors page, selecting the monitor, and copying the link address. See Get a monitor's details in the Datadog documentation for more information.
To add a Datadog Health Check:
Open the Health Checks page in the Gremlin web app, click + Health Check, then select Datadog from the Integrations drop-down. If you use a Datadog site other than the default (US1), select it in the drop-down list.
If you've already authenticated this Datadog site (i.e., you only see a Next button), click Next and continue to step 3. Otherwise, follow these steps:
In the Datadog web app, copy or create the API key and application key.
In the Authentication section, paste the API key and application key into the corresponding box.
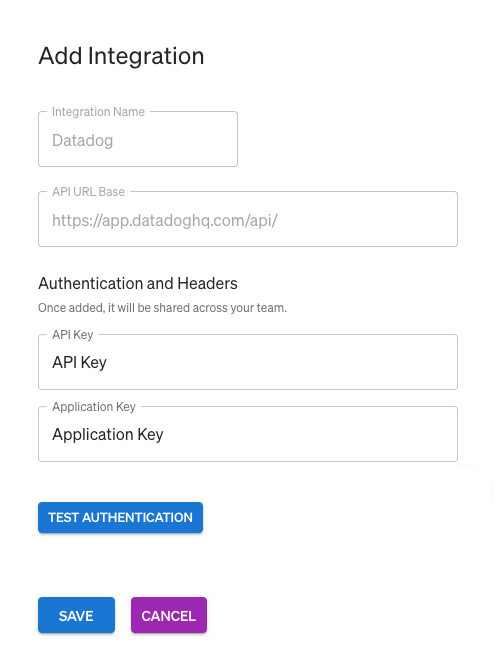
Click Authenticate Observability Tool. To validate the endpoint with the added header, Gremlin calls the following API:
<API Base URL>/v2/current_user/application_keysIf the authentication passes, click Save Authentication, then click Next.
Add your Datadog monitor. You can either add the monitor or alert URL directly, or search for a monitor by name.
- To add a monitor by URL, open the Datadog web app, navigate to the Monitors page, open the monitor you want to use, then copy and paste its URL into the Monitor or Alert URL text box.
- To search for a monitor, click Search for Datadog monitor by name, enter the name of the monitor you want to use, then click Search. If your search returns results, click on the name of the monitor you want to use.
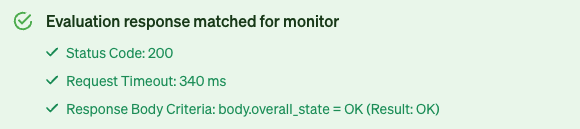
Click Test Health Check. Gremlin will invoke the GET details endpoint for that monitor and validate the JSON response. The evaluation of the Health Check is composed of: (1) an HTTP status code response (status needs to be 200-299 to pass); (2) the time in which the response was received (request timeout has to be under 1000ms); and (3) the evaluation of the
overall_statethat has to match the "OK" value to pass.If the monitor is OK, the response will look similar to this:
If the monitor is in another state like
Alert,Ignored,No Data,Skipped,Unknown, orWarn, you can still save the Health Check, but it will not evaluate to successful once a Reliability Test is run, impacting the Service's Reliability Score.
Click Create Health Check.