PagerDuty Health Check
With PagerDuty, you can use a previous or current PagerDuty incident, or a defined PagerDuty service as your Health Check. This lets you use your existing alerts and signals to measure the health of your service, and halt ongoing tests if your service becomes unhealthy.
You can retrieve a list of incidents from the PagerDuty web app. See List incidents in the PagerDuty documentation for more information.
| Example incident or service | Input value |
|---|---|
| Any triggered incidents (web) | https://acm.eu.pagerduty.com/incidents?status=triggered |
| Any triggered incidents (API) | https://api.pagerduty.com/incidents?statuses[]=triggered |
| Specific incident with ID (web) | https://acm.eu.pagerduty.com/incidents/Q2K42T1G8 |
| Specific incident with ID (API) | https://api.pagerduty.com/incidents?statuses[]=triggered&service_ids[]=PE8X |
| All services and any incident raised (web) | https://andcm.eu.pagerduty.com/service-directory?direction=asc&query=&sort_by=name&team_ids=all |
| All services and any incident raised (API) | https://api.pagerduty.com/incidents?statuses[]=triggered |
| Specific service by ID and any incident raised on it (web) | https://andcm.eu.pagerduty.com/service-directory?direction=asc&query=&sort_by=name&team_ids=all |
| Specific service by ID and any incident raised on it (API) | https://api.pagerduty.com/incidents?statuses[]=triggered |
To add a PagerDuty Health Check:
Open the Health Checks page in the Gremlin web app, click + Health Check, then select PagerDuty from the Integrations drop-down.
If PagerDuty is already authenticated, go to step 3. Otherwise, continue with these steps:
- In the PagerDuty web app, create a new API key or copy an existing one.
- In the Gremlin web app, paste your PagerDuty API key into the API Key text box under the Authentication section.
- Click Authenticate Observability Tool. To validate the endpoint with the added header, Gremlin calls the following API:
https://api.pagerduty.com/abilities - If the authentication passes, click Save Authentication, then click Next.
In the PagerDuty web app, copy the Incident or Service ID URL of the monitor you want to use.
Back in the Gremlin web app, update the PagerDuty Incident or Service ID URL with the PagerDuty Incident or Service ID.
Click Test Health Check. Gremlin will validate the JSON response and look for any triggered incident returned in the list associated with the input URL.
If the monitor is OK, the response will look similar to this:
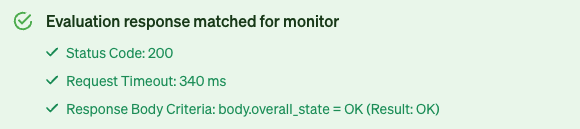
If the monitor is in another state like
Alert,Ignored,No Data,Skipped,Unknown, orWarn, you can still save the Health Check, but it will not evaluate to successful once a Reliability Test is run, impacting the Service's Reliability Score.
Click Create Health Check.