Prometheus Health Check
Prometheus health checks are configured similarly to custom health checks. To add Prometheus, you'll need the REST API endpoint of your Prometheus server and basic authentication headers.
To add a Prometheus Health Check:
Open the Health Checks page in the Gremlin web app, click + Health Check, then select Prometheus from the Integrations drop-down.
If Prometheus is already authenticated, go to step 3. Otherwise, continue with these steps:
- In the Prometheus web app, create your basic authentication password.
- In the Gremlin web app under the Authentication section, click + Add Value to add a new key/value pair.
- In the Name text box, enter "Authorization".
- In the Value text box, enter the text "Basic " followed by your basic authentication password.
- Click Authenticate Observability Tool. If the authentication is successful, click Save Authentication.
In Prometheus, copy the URL of the monitor you want to use.
Back in the Gremlin web app, paste the URL into the Endpoint URL text box.
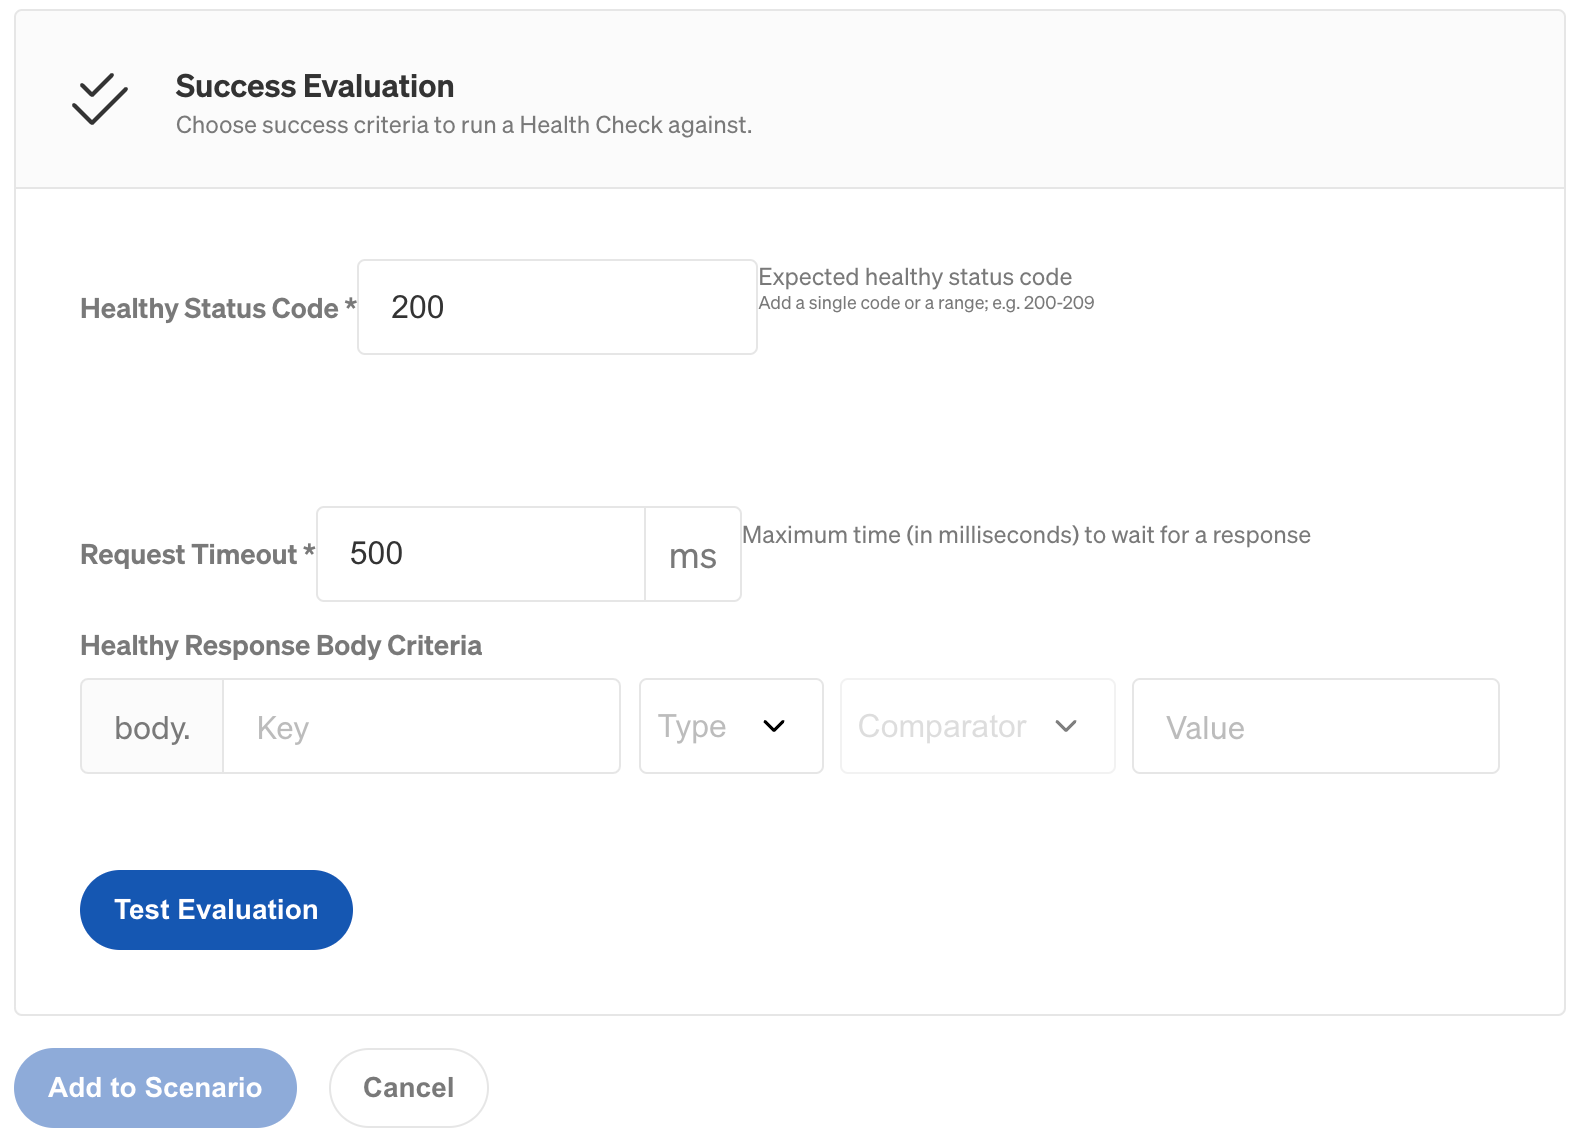
Click Test Health Check. Gremlin will send a test request and validate that it receives a JSON response.
Gremlin displays a Healthy Response Body Criteria form, where you can enter the JSON path of a specific field and compare its value to an expected value. See the custom Health Check documentation for more guidance.
Click Save.