
Chaos Engineering using Dynatrace

Introduction
Dynatrace is a software intelligence company, today we will be using their cloud infrastructure monitoring. Gremlin is a comprehensive Chaos Engineering platform.
Prerequisites
Before you begin this tutorial, you’ll need the following:
- A Dynatrace account (sign up for a trial here)
- A host running Ubuntu 18.04 to run the Chaos Engineering experiments on. This host will run the Gremlin agent. You need to have permissions to run commands as root with sudo on this host.
- A Gremlin account (request a free trial)
Overview
This tutorial will show you how to use Dynatrace for monitoring along with Gremlin for your Chaos Engineering experiments. Observability is a really important part of Chaos Engineering, this way you can monitor your experiments and view the results.
- Step 1 - Install the Gremlin agent
- Step 2 - Install Dynatrace
- Step 3 - Monitoring a host via Dynatrace
- Step 4 - Run a CPU Attack using Gremlin
- Step 5 - Run a Shutdown Attack using Gremlin
Step 1 - Install the Gremlin agent
First, ssh into your host and add the gremlin repo:
1ssh username@your_server_ipecho "deb https://deb.gremlin.com/ release non-free" | sudo tee /etc/apt/sources.list.d/gremlin.list
Import the GPG key:
1sudo apt-key adv --keyserver keyserver.ubuntu.com --recv-keys C81FC2F43A48B25808F9583BDFF170F324D41134 9CDB294B29A5B1E2E00C24C022E8EF3461A50EF6
Install the Gremlin agent and daemon:
1sudo apt-get update && sudo apt-get install -y gremlin gremlind
First, make sure you have a Gremlin account (sign up here). Then, we will grab the credentials needed to authenticate the agent we just installed. Log in to the Gremlin App using your Company name and sign-on credentials. (These were emailed to you when you signed up to start using Gremlin.) Click on the right corner circular avatar, selecting “Company Settings”.
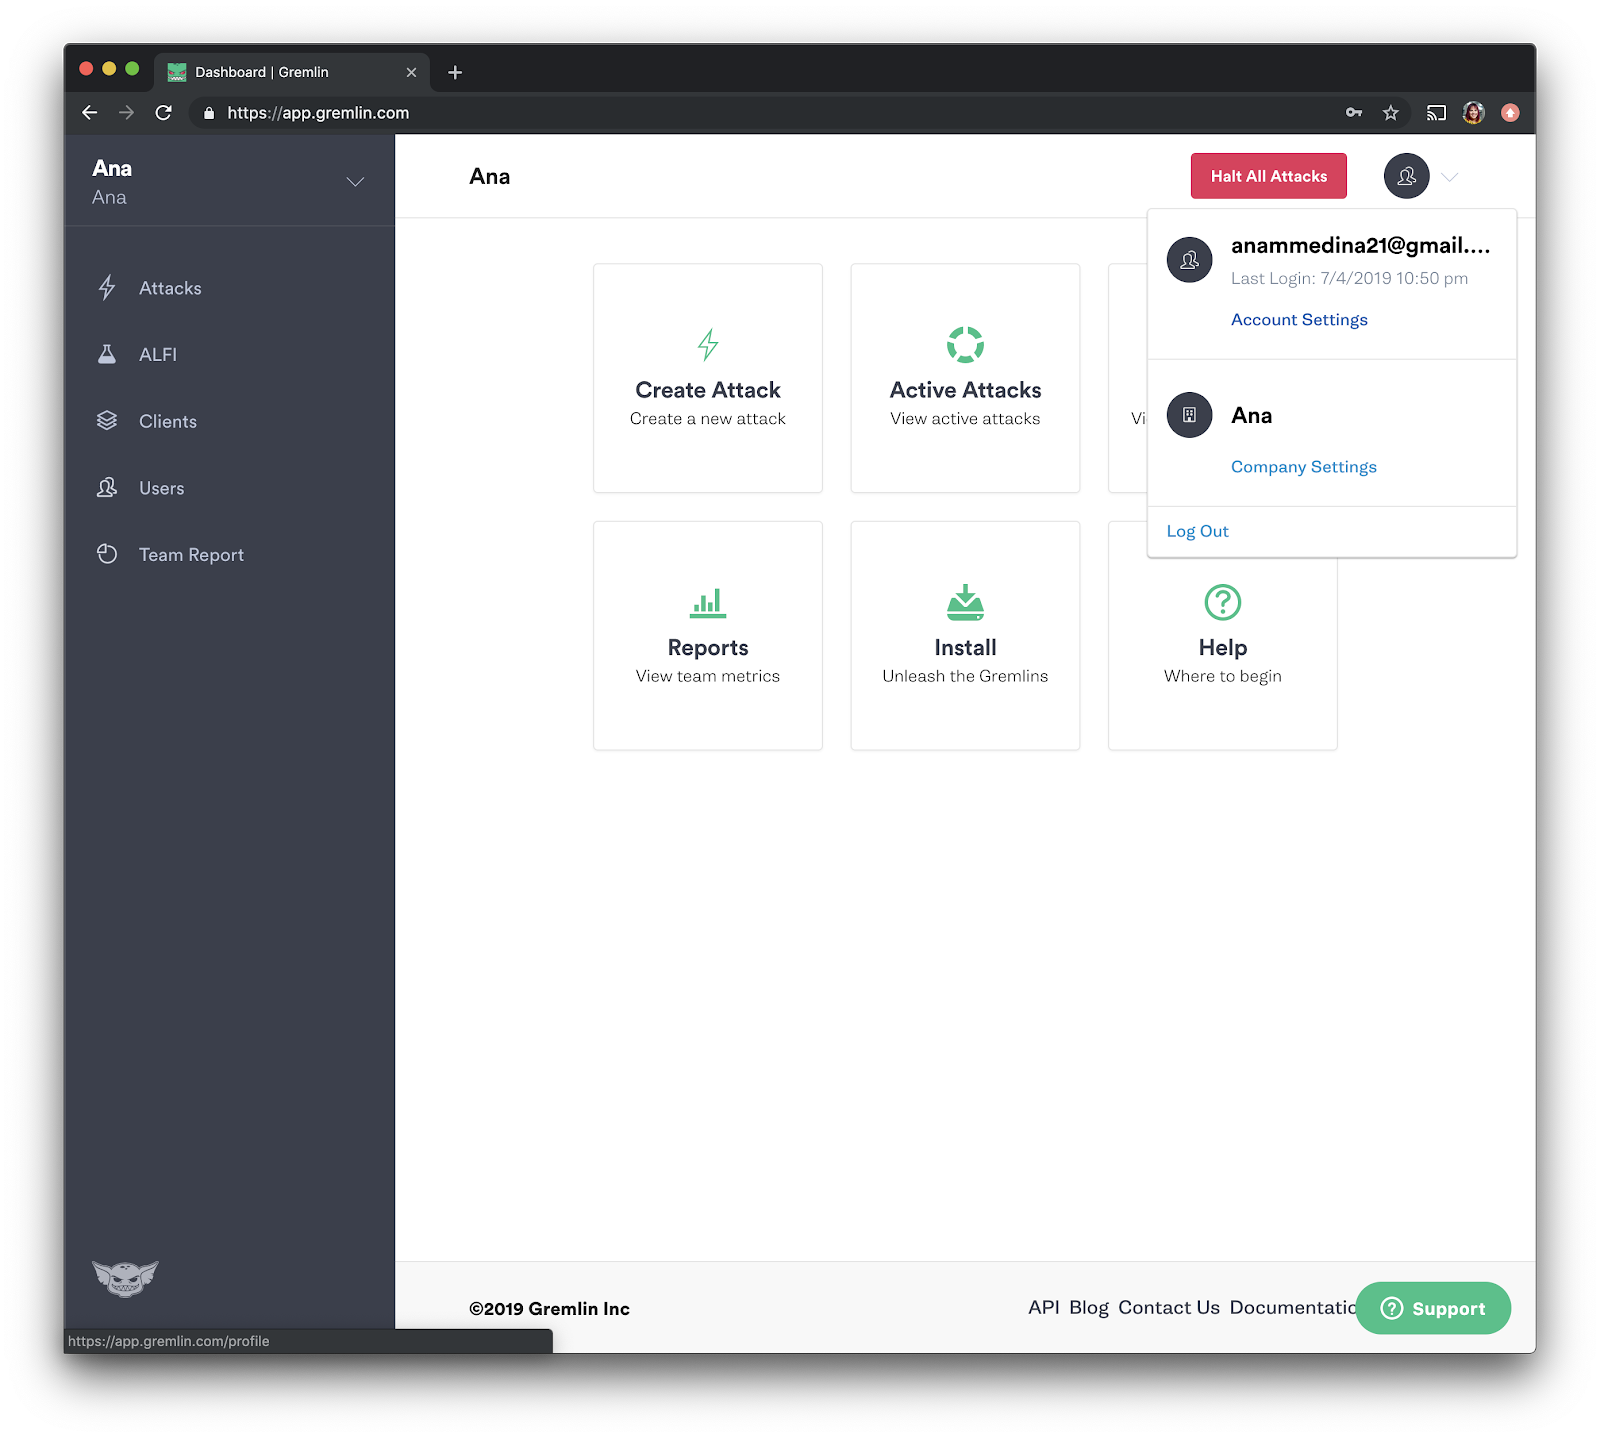
Then, select the team you need. The ID you’re looking for is found under Configuration as “Team ID” click on your Team. Make a note of your Gremlin Secret and Gremlin Team ID.

Now, we will initialize Gremlin and follow the prompts.
1gremlin init
Use the credentials you have saved from the last step.
Step 2 - Install Dynatrace
We are going to continue by setting up Dynatrace (sign up for a trial here). After creating an account, on the left side go over and select “Deploy Dynatrace” and then press “Start Installation”. We will be selecting “Linux”.
First, we will install the package needed, it will look something like this. To install on your machine, please follow the Dynatrace documentation as it needs a token based on your account.
1wget -O Dynatrace-OneAgent-Linux-1.171.180.sh "https://cel30557.live.dynatrace.com/api/v1/deployment/installer/agent/unix/default/latest?
We will then verify the signature:
1wget https://ca.dynatrace.com/dt-root.cert.pem ; ( echo 'Content-Type: multipart/signed; protocol="application/x-pkcs7-signature"; micalg="sha-256"; boundary="--SIGNED-INSTALLER"'; echo ; echo ; echo '----SIGNED-INSTALLER' ; cat Dynatrace-OneAgent-Linux-1.171.180.sh ) | openssl cms -verify -CAfile dt-root.cert.pem > /dev/null
Run the installer:
1/bin/sh Dynatrace-OneAgent-Linux-1.171.180.sh APP_LOG_CONTENT_ACCESS=1 INFRA_ONLY=0
Step 3 - Monitoring a host via Dynatrace
Do you think you’ve configured it properly? Let’s find out by running a Chaos Engineering experiment!
Log into dynatrace.com, and on the left navigation menu select “Hosts”. You should see the host that you installed the Dynatrace on. If they don’t appear immediately, you might need to wait a few minutes for the new agent data to display. You can also try refreshing your browser.

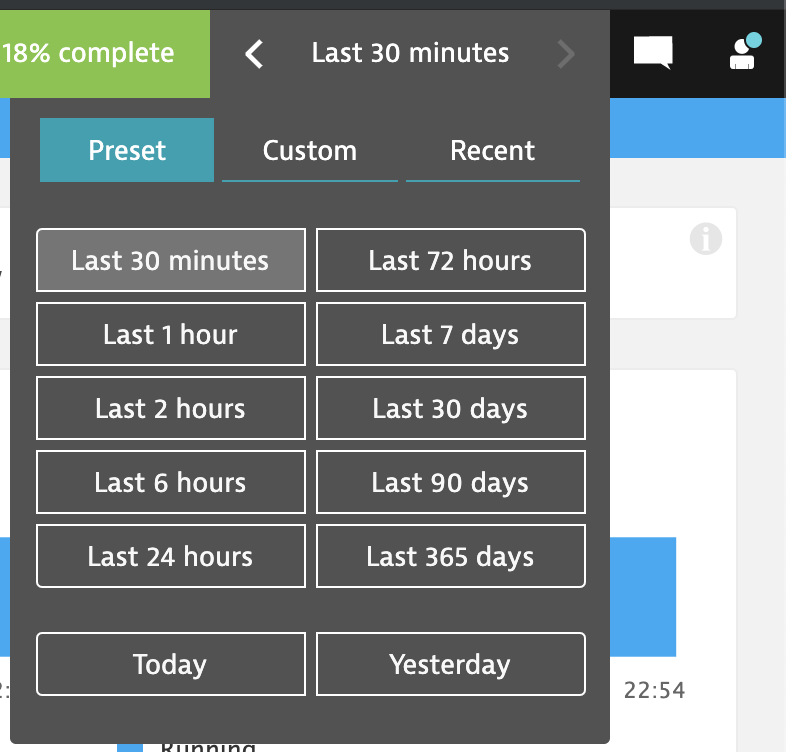
Next, we will now click on the specific host we will be running an experiment on and then change the time selector by going to the navigation bar and on the right top corner changing the refresh state from “Last 2 hours” to “Last 30 minutes”.
Step 4 - Run a CPU Attack using Gremlin
Our first Chaos Engineering experiment will help us validate that we have configured our Monitoring properly. Our hypothesis is, “When we consume CPU resources, our monitoring tool, Dynatrace, will show this increase”. Going back to the Gremlin UI, select Attacks from the menu on the left and press the green “New Attack” button. We will be choosing the host you’ve installed Gremlin on from the list.

We will now go over to choosing the attack we want to run. We will run a resource Chaos Engineering Attack, select “Resource” and choose “CPU” from the options. We will make the length 300 seconds, ask it to consume all cores at 100 percent, and then press the green button to unleash the Gremlin.

Experiment Results
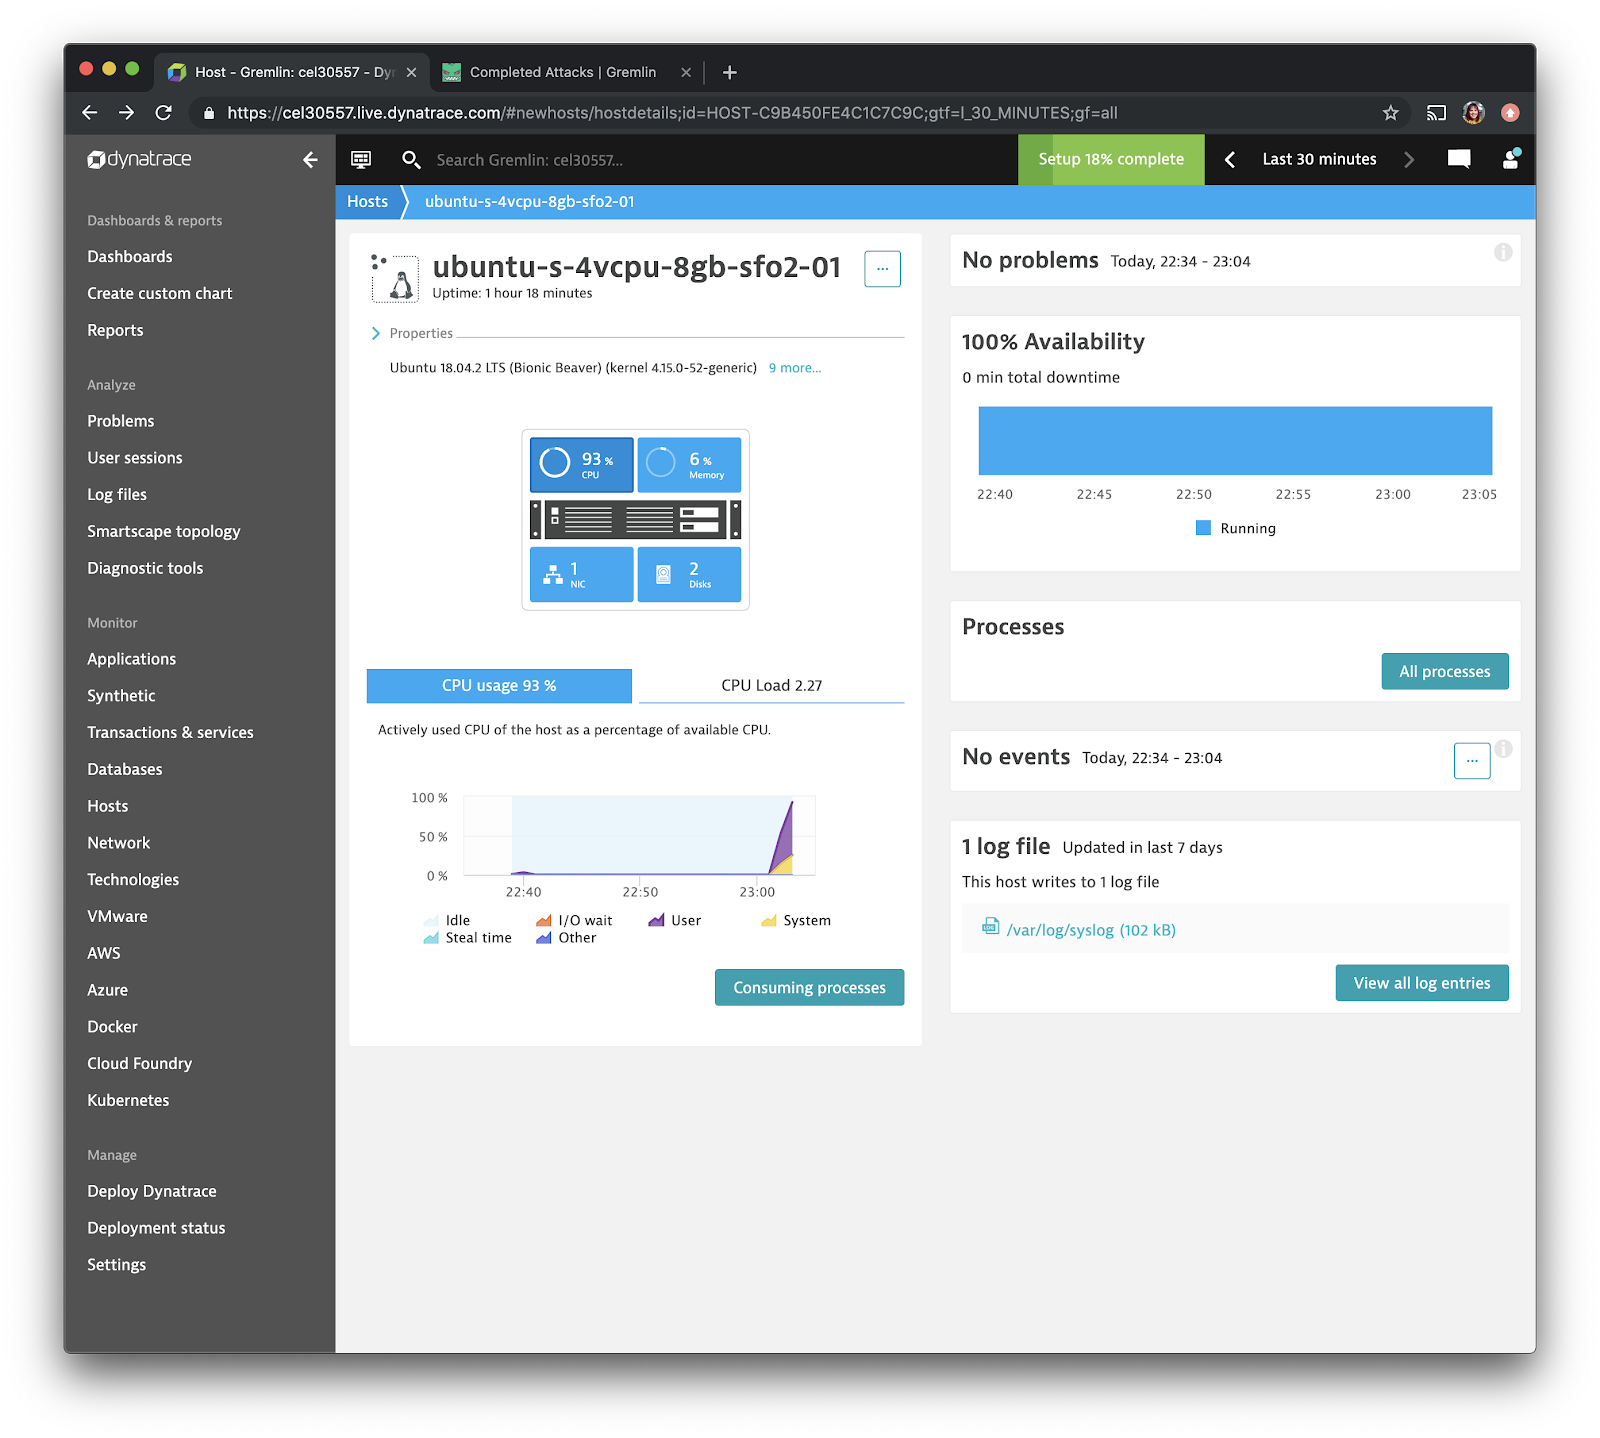
Our hypothesis was, “When we consume CPU resources, our monitoring tool, Dynatrace, will show this increase”. If we configured everything properly, Dynatrace will be displaying the CPU spike on the host, an example of that can be seen below.
Step 5 - Run a Shutdown Attack using Gremlin
Our second Chaos Engineering experiment will help us validate that our monitoring tool will inform us that our host has shutdown. Our hypothesis is, “When we shutdown our host, we expect, our monitoring tool, Dynatrace, will show information of this.” Going back to the Gremlin UI, select “Attacks” from the menu on the left and press the green “New Attack” button. Once again, we will be choosing the host you’ve installed Gremlin on from the list.
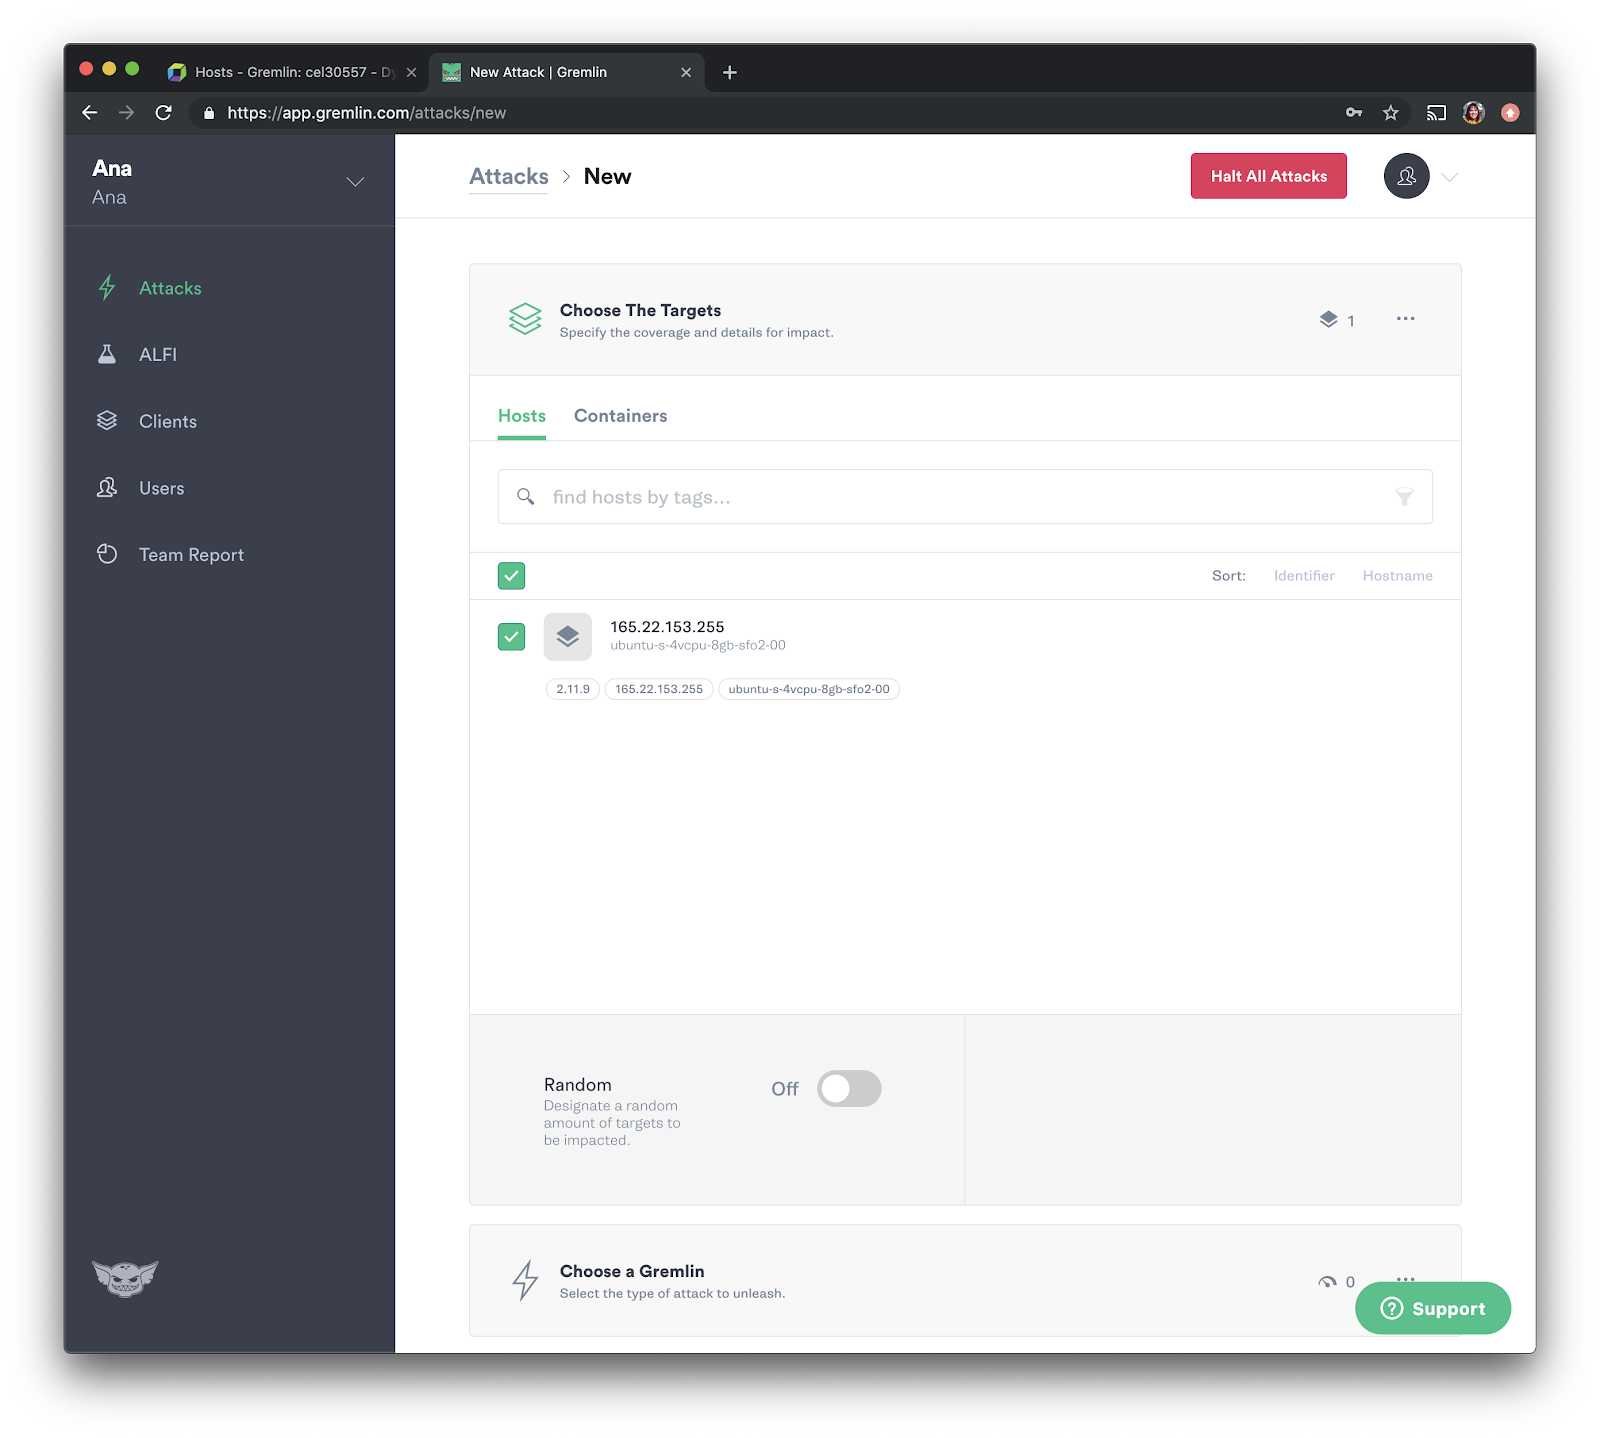
We will now go over to choosing the attack we want to run. We will run a state Chaos Engineering Attack, select “State” and choose “Shutdown” from the options. We will make the delay be 0 and turn off rebooting the host, then we will press the green button to unleash the Gremlin.

Experiment Results
Our hypothesis was, “When we shutdown our host, we expect, our monitoring tool, Dynatrace, will show information of this.” If we configured everything properly, on their Web UI Dynatrace will be displaying a red notification on their top navigation bar. An example of that can be seen below:

We can go ahead and click the red notification and will be navigating to their problems page and selecting the notification for this host. You should see something that reads “Host or monitoring unavailable.”

We are also able to dive a bit deeper by selecting the impacted infrastructure component from the list. This will display more specific metrics that include the availability % of the host.
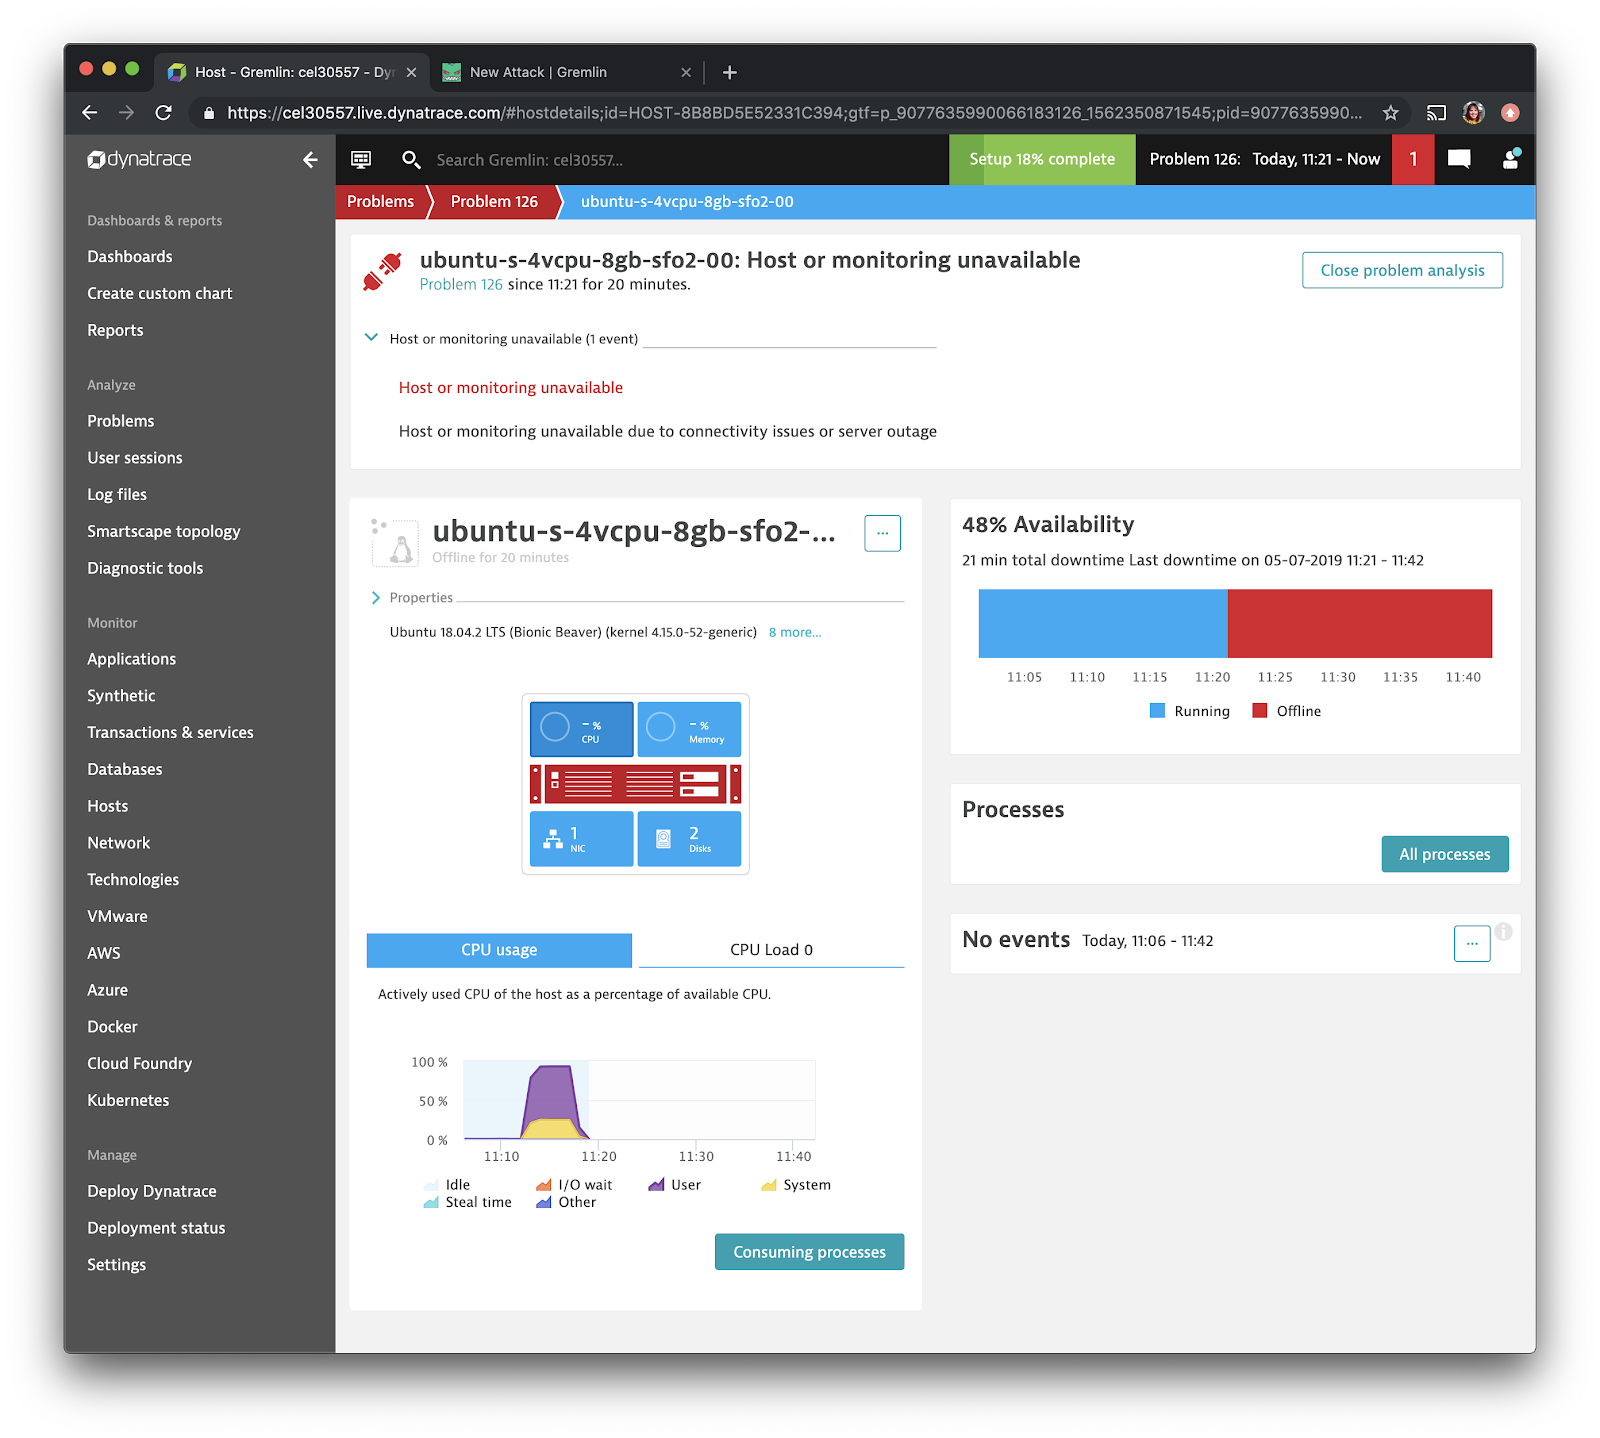
In addition, it’s great to have our systems alert us when something goes wrong as soon as possible. We constantly want to think about being more proactive about service and request failures. In this experiment, the Dynatrace Problems shown above can added and posted to a Slack channel using Dynatrace’s Slack Integration (feel free to add Gremlin’s Integration too, learn how to here.)
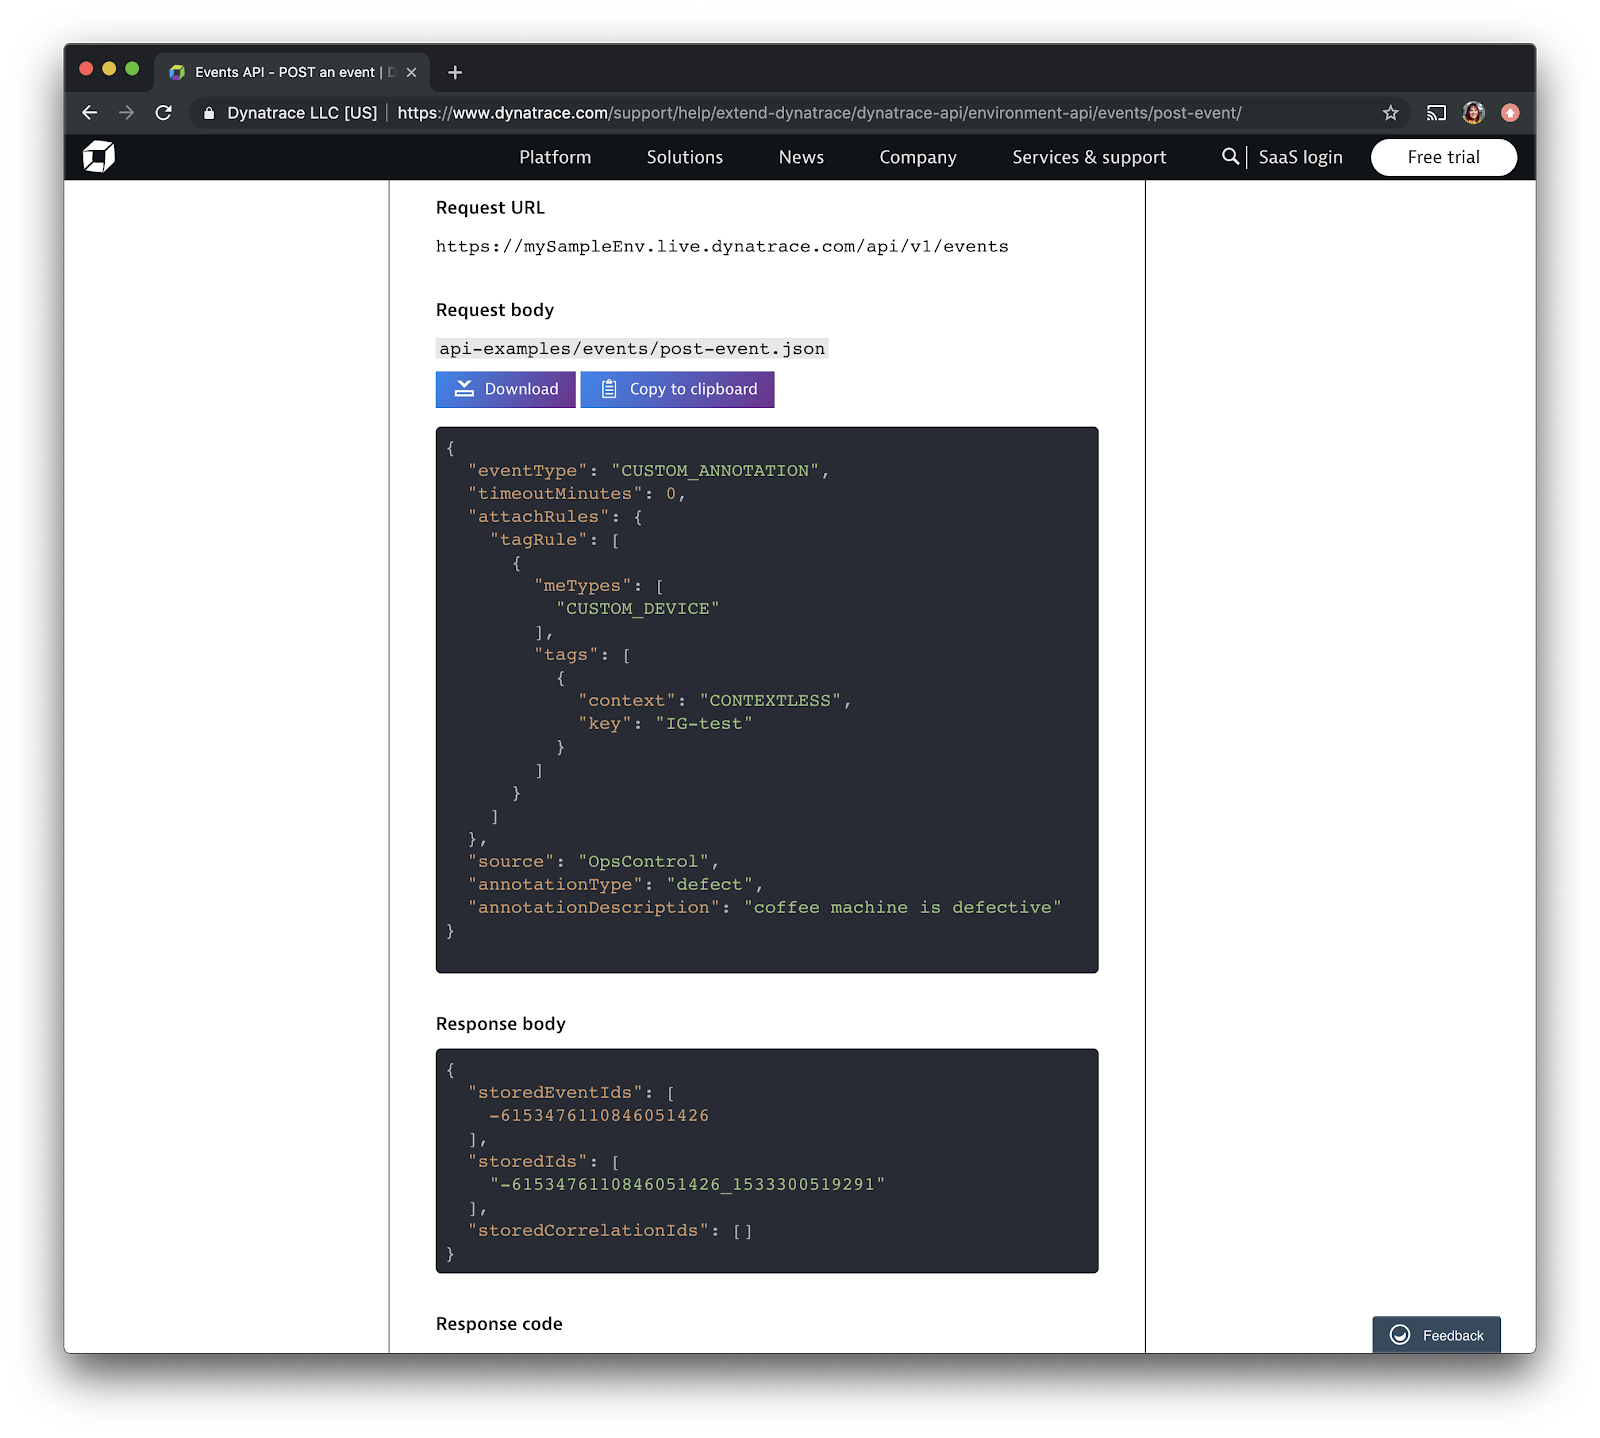
If you want to visualize when Chaos Engineering experiments are happening, you can use Gremlin's webhooks and Dynatrace's Events API. Check out the tutorial here.
Conclusion
Congrats! We’ve now seen how you can use Gremlin to perform CPU and Shutdown attacks and test your Dynatrace Monitoring. As a next step, setup the Dynatrace Events API with Gremlin or create custom dashboards. If you have any questions at all or are wondering what else you can do with this demo environment, feel free to DM me on the Chaos Slack: @anamedina.
Join the Chaos Engineering Slack
Related


Avoid downtime. Use Gremlin to turn failure into resilience.
Gremlin empowers you to proactively root out failure before it causes downtime. See how you can harness chaos to build resilient systems by requesting a demo of Gremlin.
Get started